
Felix Sargent
Engineering Manager, writer, and electoral reform advocate
St. Louis Approval Voting: What the Cast Vote Records Reveal
August 29, 2025
This article is a companion piece to our interactive data analysis and visualizations from this election at approval.vote.
The St. Louis, MO Primary Municipal Election was held on March 4, 2025. The election included multiple races: Mayor, Comptroller, Alderman Ward 3, and Alderman Ward 11. While we have cast vote record data for all these races, this analysis focuses specifically on the mayoral contest, which provides the richest dataset for understanding voter behavior under approval voting.
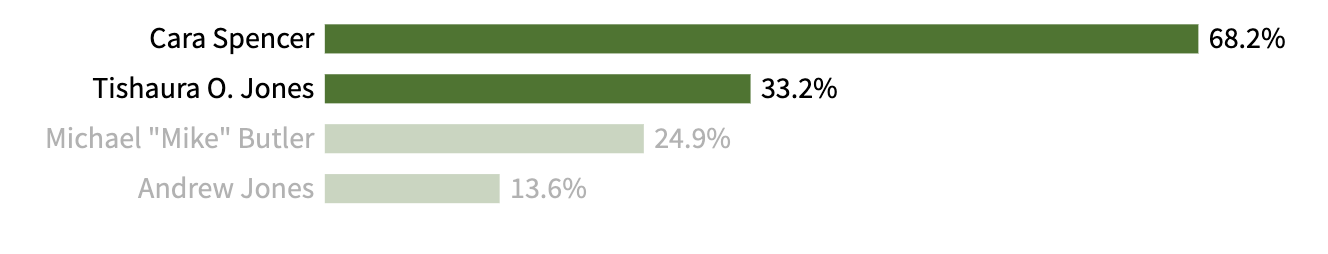
In the Mayor’s Race, Cara Spencer (68.2%) and incumbent Tishaura O. Jones (33.2%) advanced to the general election, defeating Michael “Mike” Butler (24.9%) and Andrew Jones (13.6%). With 34,945 ballots cast and 48,908 total approvals, there was an average of 1.4 approvals per ballot. St. Louis runs a unified, non-partisan primary in which candidates may run and are listed without any party affiliation next to their name. The top two winners go head to head in the General Election. This is the sixth ever election in the United States using Approval Voting, and the first ever approval voting election where we have the Cast Vote Records from the election. These records reveal fascinating details on St. Louis voters’ preferences.
Why St. Louis Adopted Approval Voting
St. Louis moved to approval voting following the embarrassing 2017 mayoral primary, where Lyda Krewson won with just 32.0% of the vote against six Black candidates. This election starkly demonstrated the devastating effects of vote splitting under the traditional “Choose One” system — a white candidate prevailed despite most voters preferring other options, simply because the majority coalition was divided among multiple candidates. The 2017 result made clear that St. Louis needed a voting system that could reveal true voter preferences rather than rewarding vote splitting.
Understanding Cast Vote Records
We’re used to looking at voting results as the aggregates— for example, a candidate got 52% of the vote. The Cast Vote Record allows us to see how a voter voted across all of the races on their ballot. For the normally used “First Past the Post” voting system where you Choose One this doesn’t often provide a lot of insight, but Approval Voting elections are different.
Under Approval Voting you can pick all the candidates you like. Put another way, your ability to support a candidate in a race is completely independent of your ability to support other candidates. From a data perspective, each candidate is in their own race, and voters choose to either support them, or not. This is where Cast Vote Records can reveal very interesting details. CVRs can show us, ballot by ballot, people’s preferences and allow us to see which candidates voters thought were similar, and how voters were able to use the flexibility of approval voting to support multiple candidates.
Approval Distribution: How Voters Used the System
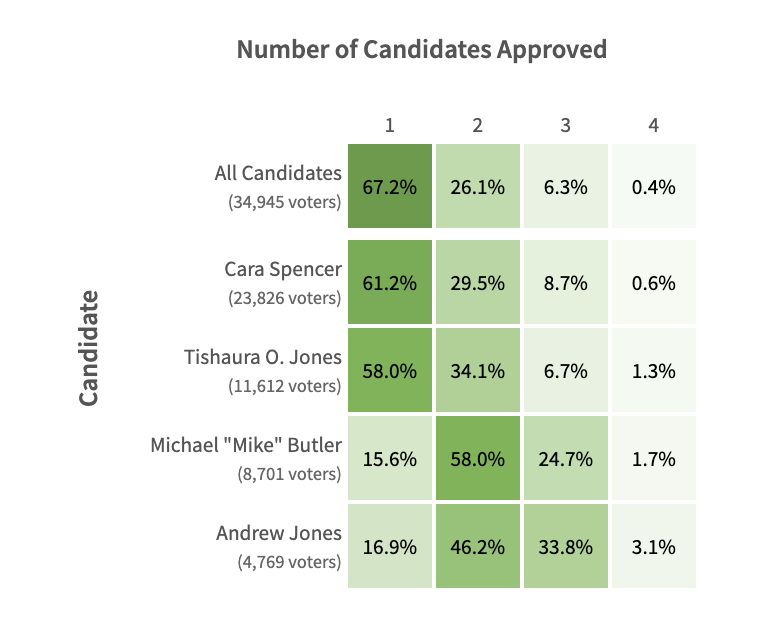
Our analysis of the Approval Distribution reveals that a third (32.8%) of voters supported more than one candidate, with a quarter (26.1%) approving exactly two candidates, 6% approving three candidates, and half a percent (0.4%) approving all four. When we break down the approvals by candidate, we find dramatic differences in voting patterns. While supporters of the front-runners showed more focused support (38.8% of Spencer supporters and 41.9% of Tishaura O. Jones supporters approved multiple candidates), supporters of non-front runners Michael “Mike” Butler and Andrew Jones were far more likely to express broader preferences, with 84.4% and 83.1% respectively voting for more than one candidate.
Debunking the Bullet Voting Myth
One of the great myths used against Approval Voting is that voters will “Bullet Vote” (only approve of one candidate). FairVote (the US organization; FairVote Canada and FairVote UK are unassociated) insists that in Approval Voting elections voters will not take advantage of the ability to support multiple candidates because of the chance that a less favored candidate will win because of their vote. In the worst case scenario, they hypothesize, this would devolve an approval voting election into a “Choose One” First Past the Post election, along with the horrific vote splitting we see in those elections.
FairVote defines bullet voting as:
Bullet voting: insincerely expressing a preference for only a single candidate to increase that candidate’s chance of victory. This strategy applies to any degree of insincere preference truncation, such as expressing a preference for two candidates when one sincerely prefers three.
The St. Louis data decisively refutes these concerns. Our analysis demonstrates that in real-world elections voters use approval voting to support all the candidates they like. While some voters genuinely preferred only one candidate (a perfectly valid choice), the system enabled nuanced preference expression where it mattered most. For supporters of Mike Butler and Andrew Jones - voters whose voices would have been completely silenced in a traditional primary - 84.4% and 83.1% respectively were able to express additional preferences. This wasn’t strategic voting or gaming the system; it was honest preference expression that approval voting enables.
The Expressiveness Question
RCV supporters claim that approval voting is less expressive than ranked systems because individual ballots don’t show fine-grained preferences between approved candidates. This intuition, while understandable, misses how approval voting achieves expressiveness at the aggregate level.
Consider a voter who approves Spencer and Butler but not Tishaura O. Jones or Andrew Jones. While their ballot doesn’t rank Spencer versus Butler, it does reveal four preference relationships: Spencer > Tishaura O. Jones, Spencer > Andrew Jones, Butler > Tishaura O. Jones, and Butler > Andrew Jones. Other voters make different approval choices—some might approve only Spencer, others might approve Spencer and Tishaura O. Jones, and still others might approve all except Tishaura O. Jones. These varied patterns collectively reveal the electorate’s preferences with remarkable precision.
This is where the law of large numbers becomes crucial. Individual voters who can’t differentiate between two candidates they both like statistically tend to have similar relative preferences to the broader electorate. Research by voting systems experts shows that approval voting consistently produces more accurate results—meaning outcomes that better satisfy the average voter—than even ranked choice voting with completely honest voters, because approval voting captures what matters most: which candidates voters genuinely support versus those they oppose.
Coalition Patterns: The Co-Approval Matrix
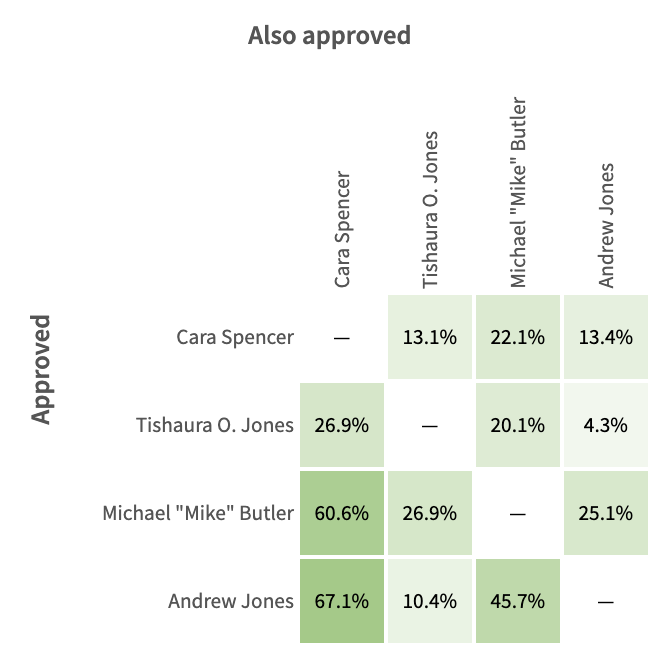
The Co-Approval matrix shows the fraction of voters who approved one candidate that also approved the other. This reveals voting patterns and candidate coalitions. The data shows fascinating cross-support patterns: 45.7% of Andrew Jones supporters also approved Mike Butler, while 25.1% of Butler supporters reciprocated that support. Both of these candidates’ supporters showed significant cross-approval with Cara Spencer (60.6% of Butler supporters approved Spencer, 67.1% of Andrew Jones supporters approved Spencer). In contrast, there was much less overlap between Tishaura O. Jones and the other candidates, with only 26.9% of Butler supporters approving Tishaura O. Jones and just 10.4% of Andrew Jones supporters approved of Tishaura O. Jones. This suggests Cara Spencer, the highest approved candidate, successfully positioned herself as a consensus candidate who could attract support from across the political spectrum.
Election-Wide Coalition Patterns
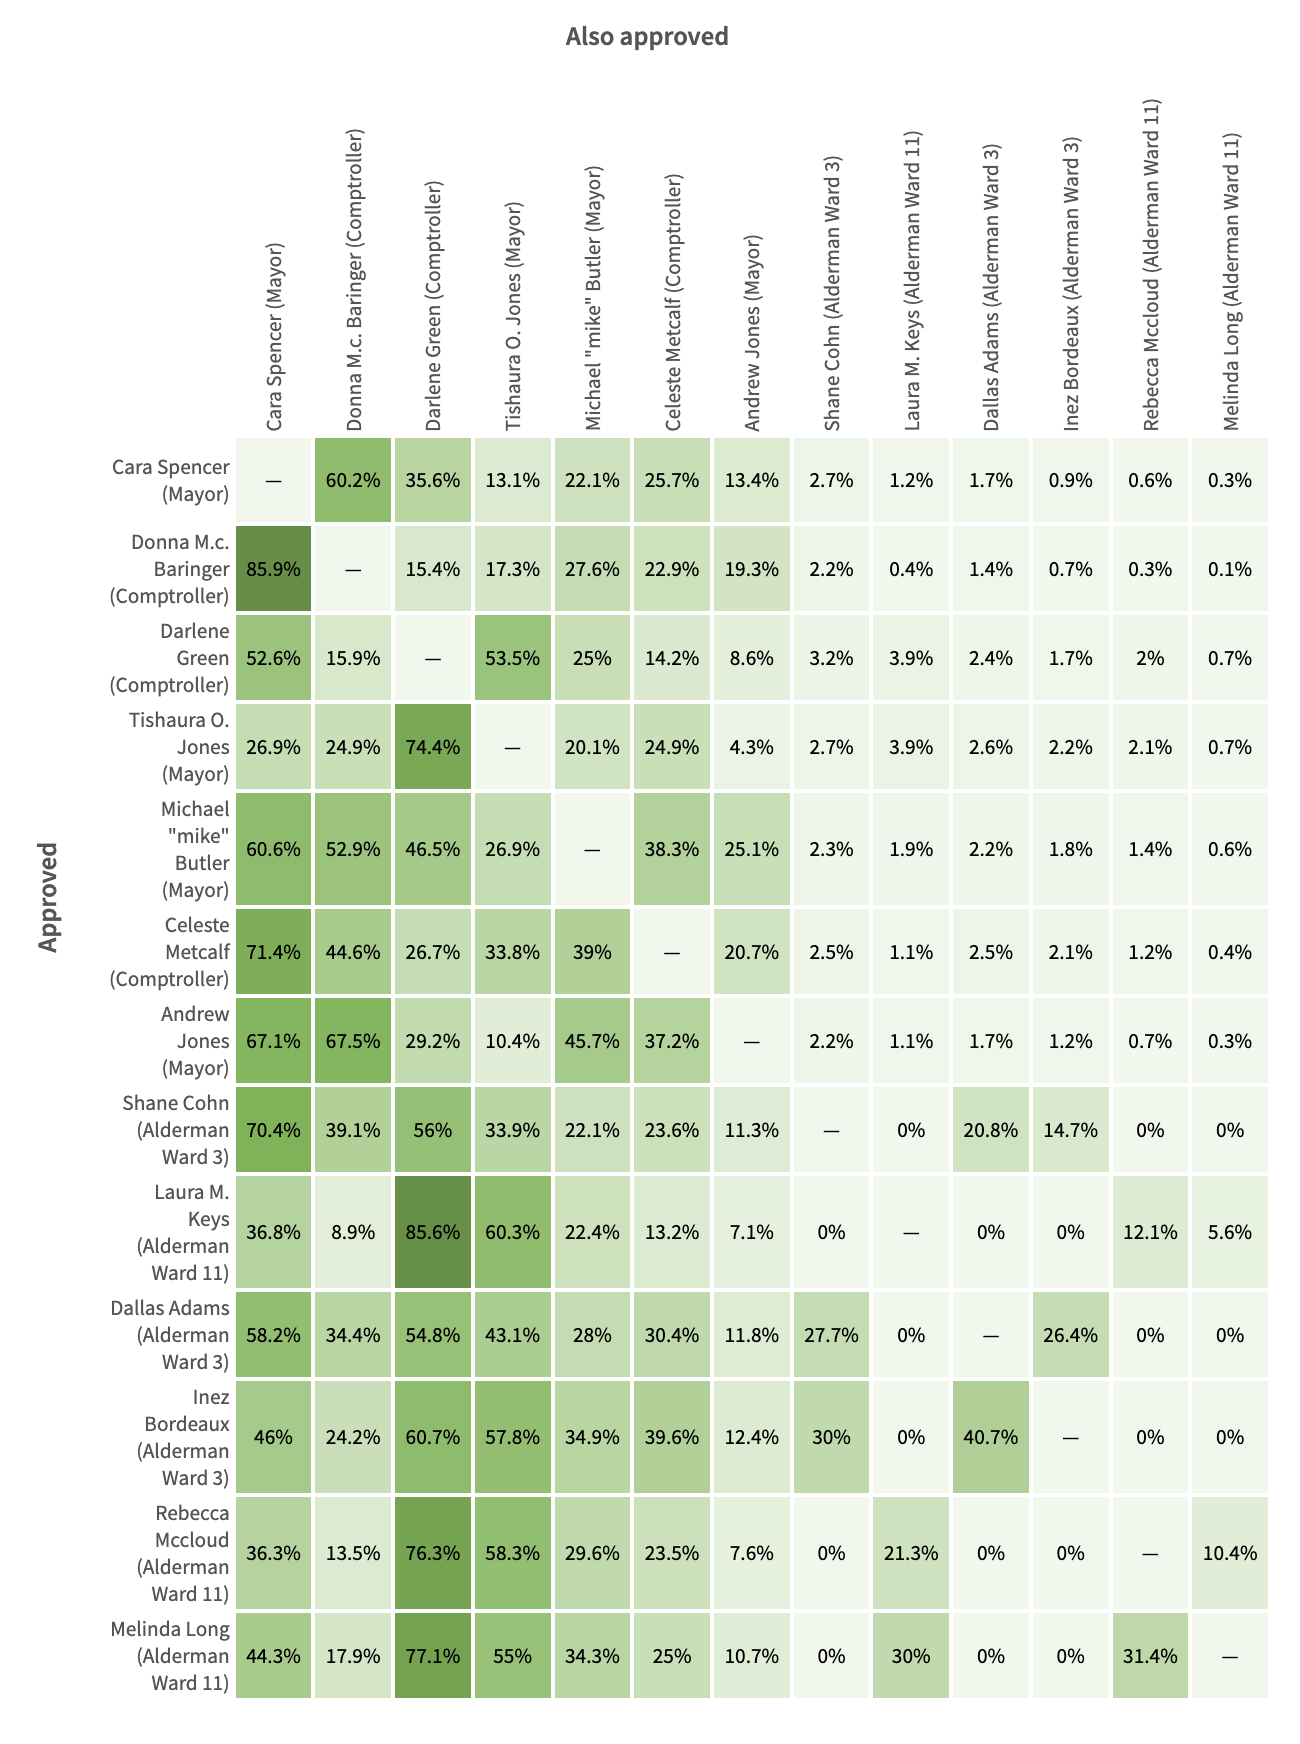
The election-wide co-approval matrix extends our analysis beyond the mayoral race to examine potential coalitions across all races on the ballot—Mayor, Comptroller, and the two Alderman contests. While this cross-race analysis reveals interesting political dynamics and voter behavior patterns, it’s important to note that these correlations are more academically fascinating than practically relevant to approval voting’s performance. The matrix shows how voters who supported certain mayoral candidates tended to align with specific candidates in other races, offering insights into the broader political coalitions and ideological groupings within St. Louis. However, unlike the within-race co-approval patterns that directly demonstrate approval voting’s ability to reveal voter preferences and candidate positioning, these cross-race correlations primarily illuminate the existing political landscape rather than the voting method’s effectiveness.
Opposition Voting: The “Anyone But” Analysis
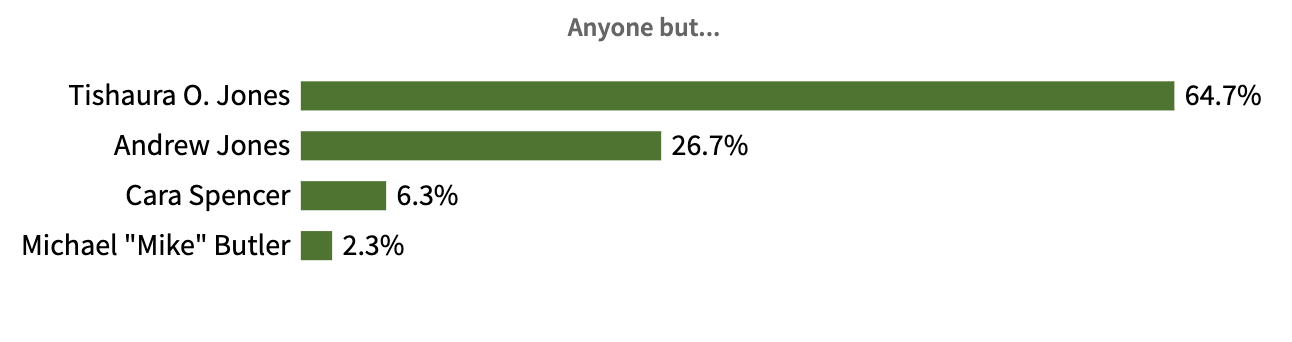
The “Anyone But …” analysis examines the 2,200 voters (6.3% of all ballots) who marked every candidate except one. These ballots represent the strongest form of negative voting possible under approval voting - essentially saying “I’ll support anyone except this person.” The data reveals stark opposition patterns: 64.7% of these voters specifically excluded incumbent Mayor Tishaura O. Jones, while 26.7% excluded Andrew Jones, 6.3% excluded Cara Spencer, and only 2.3% excluded Mike Butler. This suggests Tishaura O. Jones inspired the most ardent opposition, while Butler was viewed least unfavorably—even by voters who didn’t actively support him.
Comparing Approval Voting vs Ranked Choice Voting
Having the full cast vote records from St. Louis creates a unique opportunity to compare voting systems in practice. The site that hosts this analysis, approval.vote, is a sister site to ranked.vote, which provides similar detailed results for ranked choice voting elections.
The contrast in data complexity is striking. Approval voting produces clean, interpretable metrics like our Approval Distribution charts and Co-Approval matrices that clearly show voter coalitions and preferences. Ranked choice voting, by comparison, generates far more complex data patterns. The best visualization for RCV is the Sankey diagram—see the 2021 NYC Mayoral election as a prime example, where 13 candidates required eight elimination rounds to reach a conclusion.
Instead of our straightforward approval metrics, RCV analysis relies on Pairwise Preferences, First Alternates, and Final Vote by First Choice breakdowns. This complexity isn’t just academic—it reflects how much harder RCV makes it for voters to understand outcomes and for analysts to extract meaningful insights about voter preferences, which ultimately reprsents itself in mistrust in RCV elections.
For a deeper dive into these system differences, read this detailed comparison between RCV and Approval Voting.
The Verdict: Approval Voting Works as Intended
The St. Louis data conclusively demonstrates that approval voting functions exactly as designed. Far from the “bullet voting” dystopia predicted by critics, we see a nuanced electorate that used the full flexibility of the system: one-third of voters supported multiple candidates, supporters of lesser-known candidates overwhelmingly expressed broader preferences, and clear coalition patterns emerged that would be invisible under traditional voting.
Perhaps most importantly, the system revealed genuine voter sentiment that traditional voting would have obscured. Butler and Andrew Jones supporters didn’t “waste” their votes - they expressed their full preferences while still participating meaningfully in the broader electoral choice. Spencer’s cross-coalition appeal and Tishaura O. Jones’s polarizing but still successful campaign both tell stories that “Choose One” voting simply cannot capture.
On April 8th, 2025 St. Louis had its General Election. Cara Spencer (64.15%) defeated Tishaura O. Jones (35.85%), demonstrating consistency between an Approval Voting election and a “Choose One” election with only two candidates.
The St. Louis experience demonstrates how better voting methods create a virtuous cycle of democratic improvement. Approval Voting made elections genuinely competitive, forcing representatives to work harder to earn and keep their positions. When politicians must appeal to broader coalitions rather than narrow bases, they craft more thoughtful policies that serve wider constituencies. These better laws and governance decisions compound over time, transforming St. Louis from a city known for dysfunction into one with responsive, accountable leadership. The result isn’t just better politics—it’s better outcomes for residents in everything from city services to economic development.
This transformation couldn’t have happened without the vital work of voting reform organizations: the Missouri based Show Me Integrity, and the national Center for Election Science. Both organizations remain critically underfunded despite their outsized impact. If this analysis resonated with you, consider supporting their work. Changing how we vote matters far more than winning any individual election—it’s the foundation upon which all other democratic improvements rest. For those who donate to causes, there’s no investment with higher leverage for positive change.
Special thanks to the IT team at the St. Louis City Board of Election Commissioners for making this data available.